Logistics network modelling and 3PL spend analytics
Synopsis
Responding to a geopolitically driven surge in energy prices, one of the UK’s largest food processing companies engaged Trusted Data’s expertise to develop spend reduction strategies through a logistics network modeling engagement. The client depended on various 3PL partners to distribute products across a network of over a dozen UK sites.
With rising costs across the logistics sector, exacerbated by a global oil price spike, our client took proactive measures to reduce 3PL spend. They prioritised establishing a baseline cost to serve for their UK logistics network.
Aggressively negotiating down contract haulage prices without the right data and insights would only offer limited improvement. Therefore, they aimed to gain deeper insights into the actual network cost to serve and identify areas of expenditure leakage. These steps would provide them with robust insights for more effective future contract negotiations.
Client Overview
🔸Top 5 UK food processing company by revenue
🔸Multi-site distribution with many customers being supplied exclusively from certain sites with specific SKUs
🔸Logistics had been outsourced to a large array of 3PL partners
🔸1000’s of customer locations requiring a high volume of short-shelf life products
Client Problem
“In an industry governed by strict customer SLAs and high product volumes, logistics spend often took a backseat. The client relied on decentralised logistics planning, using a site-level approach to schedule outbound logistics. This issue was worsened by a complex nationwide distribution network, increasing energy costs, and operational inefficiencies, all of which posed a threat to profitability.”
Analytics Delivery
Complete a complex analytics engagement requiring extensive data preparation and methodology design before moving into logistics network modelling and delivery simulation.
🔸Building standardised metrics from initial input data and agreeing all operational constraints to embed into modelling.
🔸Data Preparation and generating simulated distribution plan optimisation by site by day.
🔸Amalgamating key supply chain and cost to serve metrics into BI app for review with client.
The Challenge
⦿ The client faced a high volume of product movement and numerous customer locations to service within a short time frame.
⦿ They felt pressured to clear short shelf-life products from the site immediately.
⦿ Concerns over tight customer SLAs, product expiry, and daily processing volume exceeding site storage capacity added to the urgency.
⦿ Sites approached outbound logistics scheduling individually rather than cohesively.
⦿ 21 different 3PL partners had been employed across the UK to deliver the client’s products to customer locations, lacking efficient centralised planning.
⦿ As a result, 3PL partners often executed inefficient routes in overlapping areas, with less-than-optimal fill rates.
Trusted Data Approach
⦿ Conduct 2-3 workshops to define the problem and review data.
⦿ Transform data and map all relevant constraints for distribution plan simulation, including truck sizes, customer delivery windows, and load times.
⦿ Execute a short proof of concept (POC) to create an optimised distribution plan simulation for one site using recent delivery data. Trusted Data used its’ native logistics optimisation solution, Grigora, for logistics network modeling.
⦿ Benchmark Grigora’s spend projection against actual logistics spend within the POC scope.
⦿ Build a simulated distribution plan for the UK network by day and by site over a one-month period, providing the client with a baseline cost to serve for comparison against actual 3PL spend.
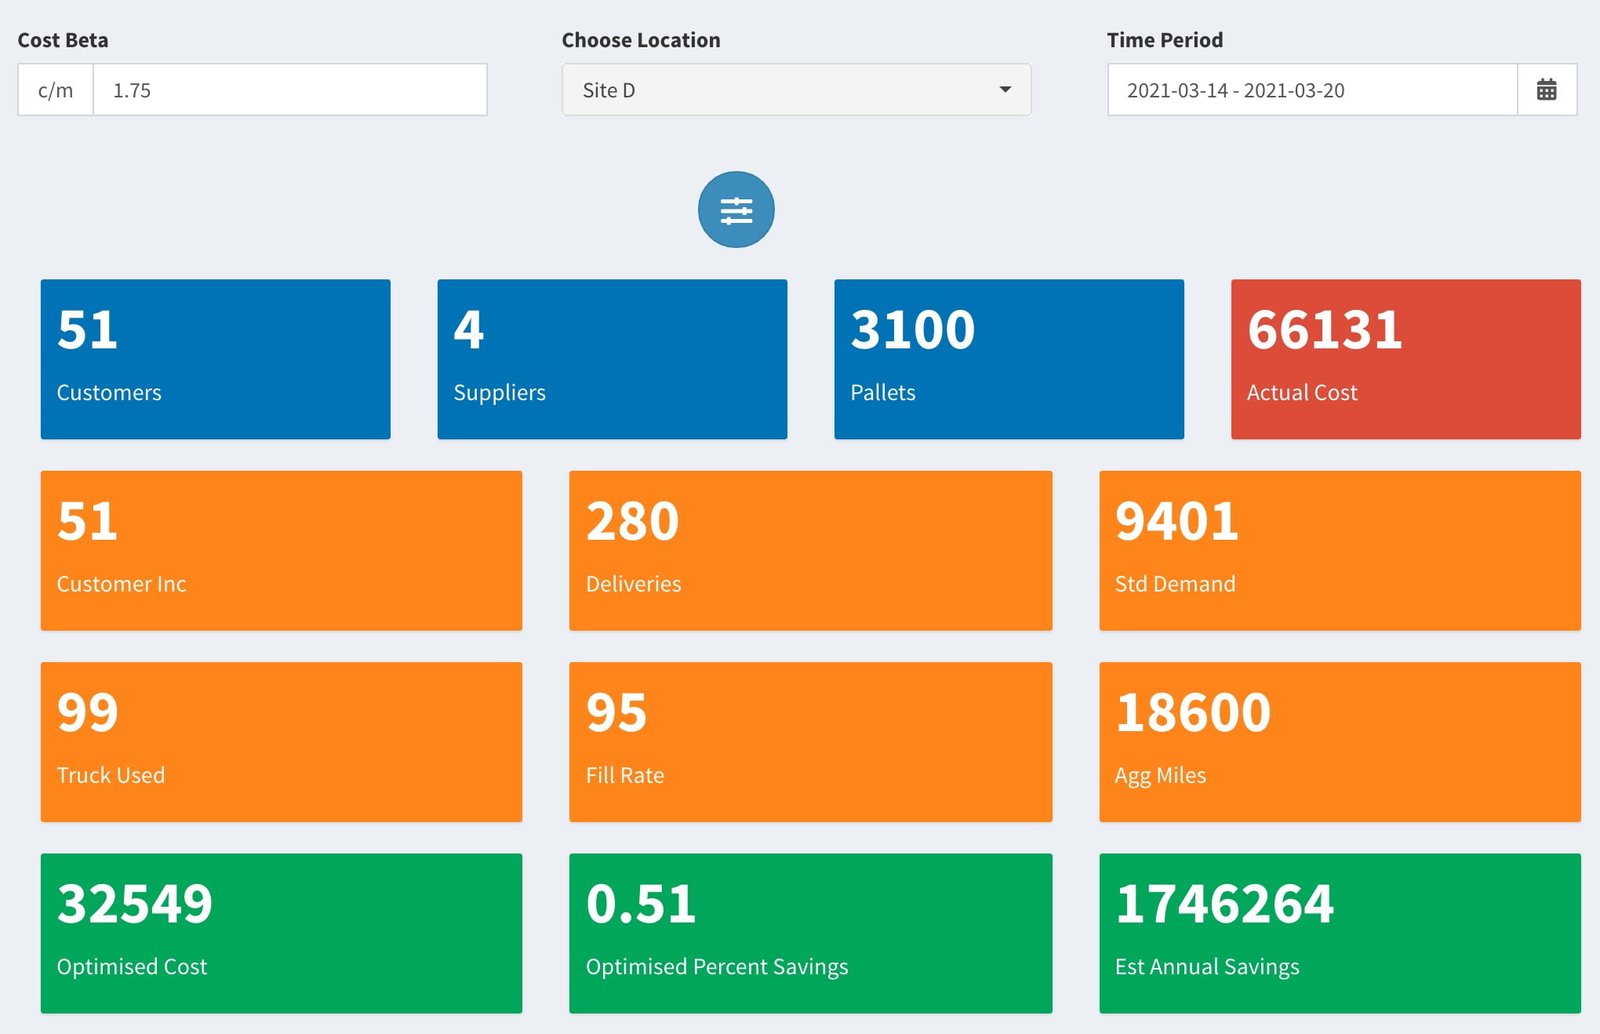
⦿ Embed all primary insights into a business intelligence (BI) application for client review. This includes modeled fill rates, actual vs. modeled spend, and customer-location cost to serve KPI.
Logistics Network Modelling and site-level cost to serve insights

OUR IMPACT
£Mn annualised spend premium (above baseline cost to serve) identified on core outbound distribution
£mn additional modelled reduction opportunity in 3PL consolidation charges
%
